A Brief History of Mapping World Climate
Every passing year lately has had some record-breaking climatic extreme, and its consequences. At the moment this is in southeast Australia, experiencing its hottest and driest year on record, Sydney reached 120°F on Sunday. The resulting wildfires are out of control, already burning an area larger than West Virginia.
So where do we get our ideas about what is normal and natural, and what is somewhat extreme, and what is simply off the scale and shouldn’t be happening? Today let us take a quick look back in time and see where our understanding of world climates comes from.
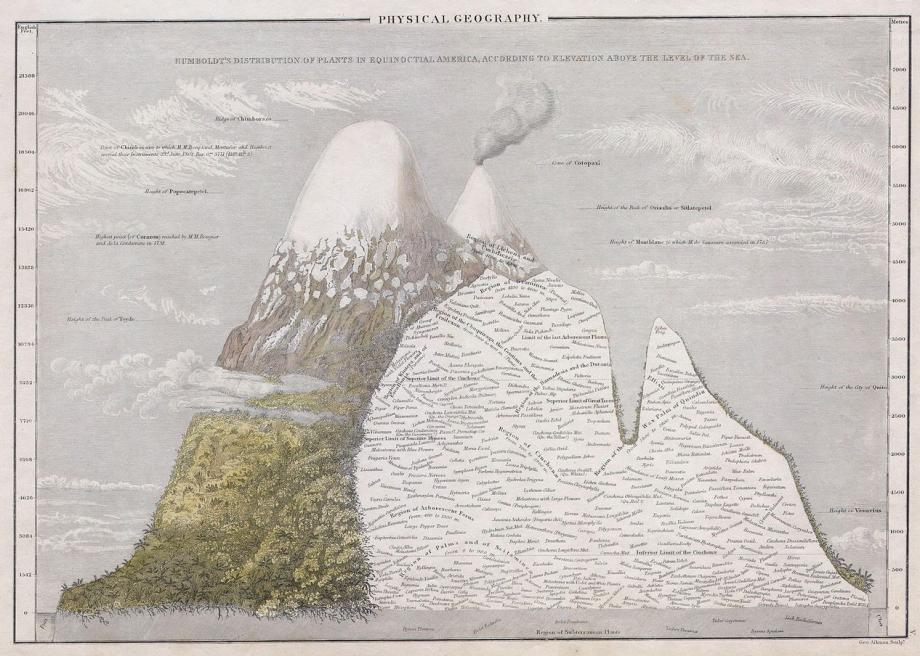
Humboldt’s drawing and correlations with altitude, published after his South American explorations.
People who lived in the Alps many centuries ago knew that the higher you climbed, the colder it became. They could also see the vegetation responding, creating altitudinal zones or layers extending from one mountain to the next. When Alexander von Humboldt traveled around South America (1801-1803), he observed the same in the Andes by climbing and mapping every mountain within his reach. He also recognized that the climatic zones of vegetation vertically up a mountain corresponded to broad latitudinal vegetation zones going from equator to poles on the flatlands. This information had considerable influence on a wide range of people, including a young Charles Darwin, who had just left on his sea voyage before its publication, and had a copy forwarded to him awaiting his arrival in Uruguay.
Sea captains of sailing ships had a substantial investment in their knowledge of climate. If you stocked up on food and water for a six-week crossing of the Atlantic and got stuck in the Doldrums and it took 12 weeks, you had a problem. And it did happen. Two regions of the Atlantic became known as the “horse latitudes,” because horses drink a lot of water and become hard to manage when desperately thirsty, so they were the first to get dumped overboard in a becalmed crisis. Following ships would encounter their carcasses in the sea.
The ships’ logs maintained by sea captains were important records of where they went and when, and the climatic patterns they encountered. When in port, the captains socialized with each other, comparing notes and expanding their data base.
The British Empire was a far flung enterprise built on seafaring, and only slightly less so were the Dutch, Portuguese, French, and Spanish Empires. Their little weather stations popped up all over the world, including onboard ships, and information from captains’ logs could be correlated and integrated with the numerical data. And it transpired that the well-known plant boundaries on land also correlated with numerical boundaries. For example, the American “palm line” – the northern limit of palm trees – spanning from southernmost Georgia to southern Texas to Southern California, corresponds to a maximum of a few hours of subfreezing temperatures during winter cold spells. Toward the other extreme, timberline means a growing season too short for real trees, whether going up a mountain or towards the poles.
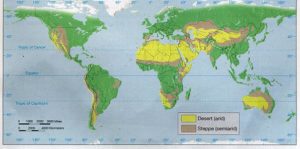
The world’s deserts.
In the 1920s, a German climatologist named Wladimir Köppen put all this together and came up with a worldwide climate classification system incorporating plant data, instrument data, and even sea captains’ observations. His whole package boiled down to a simple code of letters, for example, Iowa has a Dfa climate. And once you knew the code for an area, you could compare it to other parts of the world, for example, our midgrass prairie is now our wheat belt. It has about the same climate as the Ukraine, which was formerly called Scythia – the “land of the scythes” – alluding to its grain production. And worldwide, climatic patterns became clearer. For example, many of the world’s deserts lie at about 30° N and 30° S latitude. These are regions of few storms and little rain, and correspond to the horse latitudes at sea, with skimpy wind to drive the sailing ships.
Köppen’s classification system has been tweaked in many different directions since 1923 to serve different purposes, but it still forms the core of climate studies nearly worldwide. The pursuit of the mechanisms driving these patterns evolved into modern climatology.
Following this sketchy introduction to climatology, next week we’ll fast-forward to climate change and climate modeling, and evaluate just how good the models are.
Tags: climate, climate change, climate zones, Lon Drake